
Technology: Python, Django, d3.js Tags: Statistics, Analytics, Dashboard Image Credits: NaN
Social Impact
Social Impact is an analytics dashboard to measure social engagement. Developed for a content outlet it enables users to measure the impact of content release on social media. Engagement metrics on a variety of social media channels are collected and presented in aggregations for several campaigns. Doing so automates the reporting mechanism and offers an overview of the total impact over all campaigns.
The dashboard was created in Python, Django as well as d3.js. By measuring social media channels, aggregating information and calculating short term impacts the company is able to finetune their marketing strategy.
There are two major components to the dashboard, a collection script and an analytics platform. A cron-job triggers a script to collect social media information on all campaigns. These observations are collected in a PostgreSQL database. Time series information on the campaigns is then aggregated and portrayed in a campaign dashboard.
Dashboard
The dashboard offers information on all running campaigns. A graph on top enables the user to investigate the social channel distributions for each campaign. In addition the overview shows a development score for the last three days. The higher the score, the more aggregated activity is happening on each campaign trail. The table display on the bottom not only shows running campaigns but also foreshadows new campaigns. This helps tracking activity scores before the campaign is live and can be used to tailor advertisements towards a specific time.
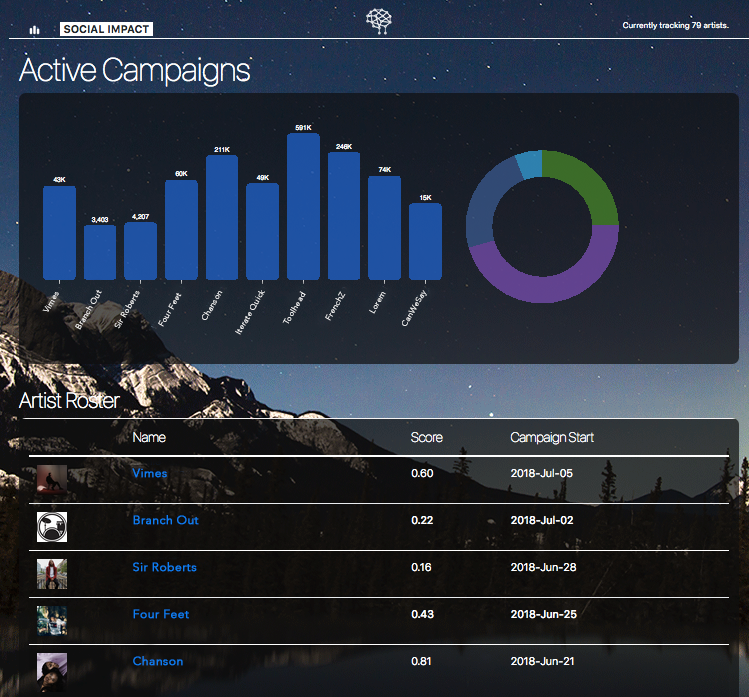
Fig: Overview dashboard. An interactive graph enables users to investigate each campaign for its follower count distribution.
Campaign Overview
The campaign overview page reports how a specific campaign is performing. A time series graph that shows the campaign development for the last 4 weeks. Relative changes in social engagement since campaign start gives a first indicator on the success of the campaign. The campaign overview offers also the ability for automatic reporting via PDF and further analysis through CSV extraction. Supplemental information is automatically retrieved through public APIs and data sources.
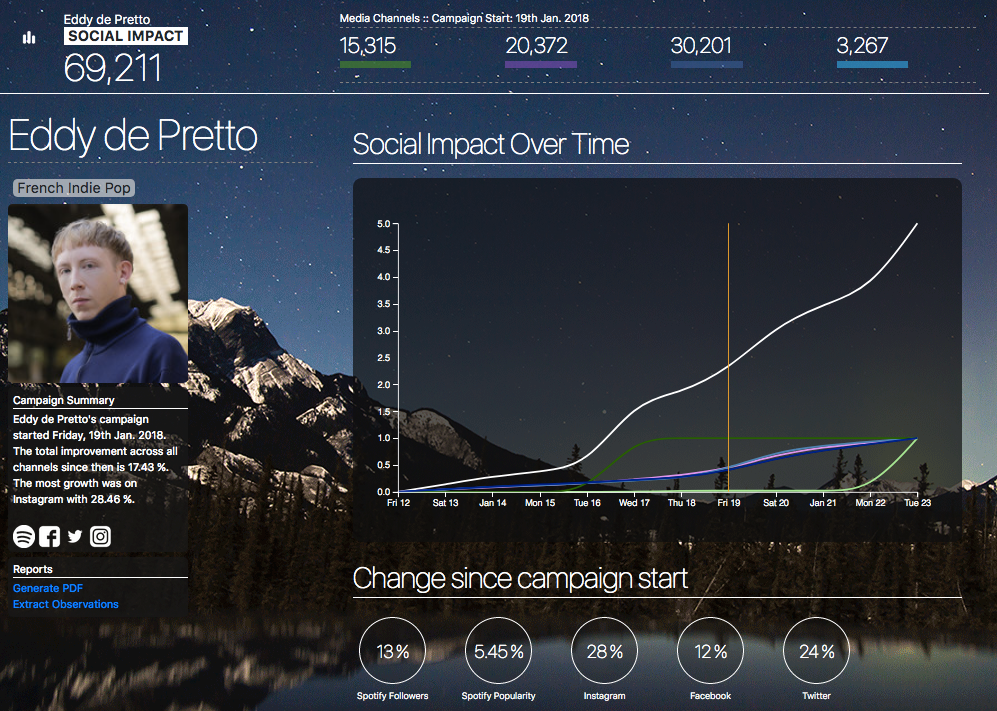
Fig: Example of a campaign overview.