
Technology: Python, sklearn, pandas Tags: Machine Learning, HR, Clustering, Random Forest, PCA Image Credits: Mantas Hesthaven on Unsplash
Predicting Why Employees Leave
Measuring employee satisfaction is a tough and highly complex task. There are a lot of different dimensions in play and turning them into quantifiable format, less to say machine-readable information, can pose a challenge. In this project a model is being used that creates employee clusters to enrich the Kaggle HR dataset and in turn predict which employee is likely to leave the company.
This report is a summary of the steps taken to create a prediction model with .9805 AUC score. The complete analysis and code can be found in this GitHub repository. Large parts of the exploratory analysis as well as discussions around scoring metrics as well as several machine learning algorithms are summarized. To get a full view on the analysis you can read the entire report.
Data Overview
The HR dataset from Kaggle has 14,999 data points and 10 variables. The available predictors are:
- Employee satisfaction level
- Last evaluation score
- Number of projects
- Average monthly hours
- Time spent at the company
- Whether they have had a work accident
- Whether they have had a promotion in the last 5 years
- Department
- Salary
The target variable is left. The goal of this project is to combine supervised and unsupervised machine learning methods to create a predictive model for employee churn. In addition the variable importance for this task is investigated.
Correlation Analysis
To gain a better intuition for corresponding features, a correlation analysis is performed. One hot encoding of salary and department makes it easy to spot correlations within subgroups.
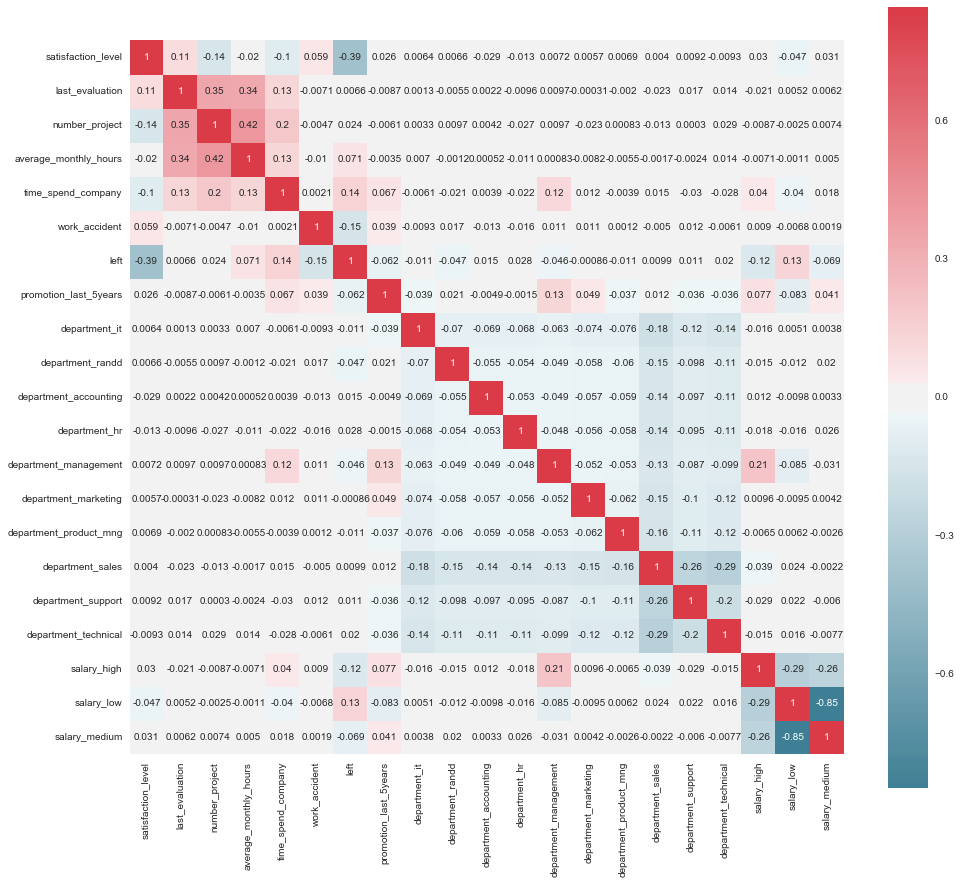
Just based on the first correlation results there are already some interesting observations:
- A high satisfaction level seems to lead to a lower leaving rate.
- Employees with higher salary are less inclined to leave.
- Low salary employees seem to leave the company more often.
- There’s a positive correlation between the time a person spends at a company and the fact if they left.
Clustering
To add an additional layer of context, employees are clustered in groups. By doing so a new discrete variable is created that might give additional insight and interpretability to the data set. Combining discrete and continuous variables for this task is tricky. Therefore the focus of this supplemental method is on continuous variables. After normalizing the variables, feature transformation is applied to detect important feature combinations.
PCA
Principal Component Analysis (PCA) is performed on the data set to discover which feature combination has the most variance. A PCA dimension can be considered a new "feature". However it is a composition of original features which are already present in the data. In addition to finding feature combinations, PCA can give insights regarding the explained variance ratio of each dimension. This suggests how much variance within the data is explained by that dimension alone and gives a good indicator about distinguishing performance of each given dimension.
from sklearn.decomposition import PCA

pca_data = hr_data.ix[:,0:5]  # select continuous variables
pca = PCA(n_components=5)  # choose the number of dimensions
pca = pca.fit(pca_data)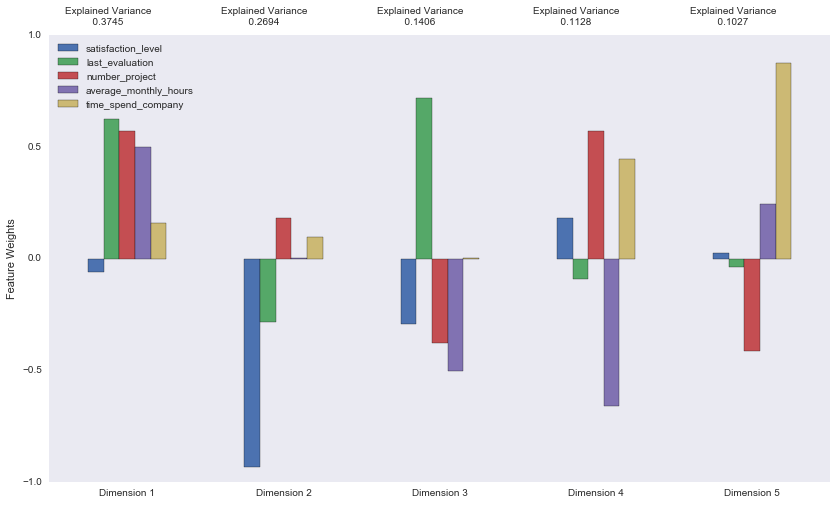
The first 3 dimensions explain 78.45 % of the variance. Adding dimension 4 pushes that value to close to 90 %. It's interesting to see that the dimension that explains the most variance has mainly positive values and indicates a negative relationship between satisfaction_level and other variables. Dimension 2 builds up on that fact, seeing a negative mix of satisfaction_level and last_evaluation in a dependency situation with time_spend_company and number_project.
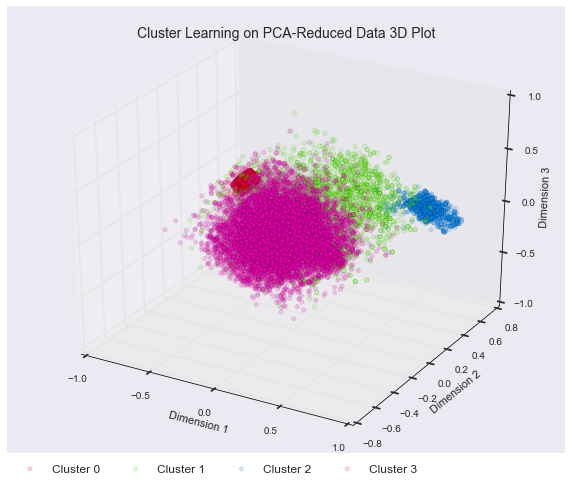
Cluster to Feature
Since clustering is usually done in an unsupervised fashion, there is no ground-truth available to test the results on. To still determine the best amount of clusters, the average silhouette score for each cluster setup is calculated. Silhouette analysis shows how well clusters separate and distinguish points. The highest silhouette score for continuous features in this dataset is achieved with 4 clusters.
Prediction
The clustering result is added to the dataset, attributing every employee to a specific cluster core. Afterwards the data is split up for training and testing (80% training / 20% testing). To make sure the target class distribution for both datasets, the data is stratified during the split. Afterwards 5 machine learning algorithms are trained on the training set using 5 cross validation turns to estimate a first performance. To figure out which hyper-parameters to use for any of the 5 algorithms, grid search is performed. A Random Forest model performs best with entropy criterion a min-sample split of 4, warm start and an estimator cut-off of 10. The final score on the test set is .9805 AUC. Since AUC can be high even though recall might be low, the results are also tested with F1 scoring. The F1 score of the model is almost as high as its AUC score (.9773).
Conclusion
This is a quick summary of the work presented here. It serves as an introduction into how unsupervised learning can be used to inform supervised learning methods for employee churn prediction. Based on the model presented here following categories should be examined strongly per individual to prevent high employee turnover:
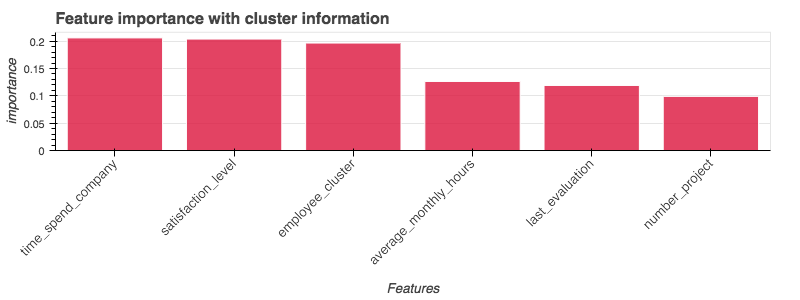
- Front-runner is
time_spend_companysuggesting employee turnover to be heavily influenced by the time an employee was with a company. The importance supports the finding that work relationships nowadays tend to have a shorter life cycle. Looking at the initial remarks about sinking tenure in the work force, this seems to be just fair. A way of anticipating this fact is opening up pathways that lead to a diverse work environment filled with new tasks and possibilities for professional growth. If the company is big enough, encouraging employees to work on their personal skill set or even promoting different possibilities within the companies might be a good way to achieve a higher retention rate. - Next up is
satisfaction_level. There are many ways to measure this in a work space. For any company to capture this rather abstract value in a correct way it has to be in touch with its employees. There is only so much information you can gain by looking at business numbers. Measuring this variable seems to be crucial for employee turnover. A finding that is supported by management and psychology studies mentioned earlier as well. - Third is
employee_cluster. As mentioned earlier,employee_clustercluster can be very helpful when it comes to categorizing top performers but also employees at risk. With additional continuous variables this could help put employees on the map in even very complex work domains. average_monthly_hourscan be an indicator for both, overworked employees or employees that are not being challenged sufficiently.- Rating employees and using their
last_evaluationscore might be a good indicator but even better would be time series information on how their performance has changed over time. In addition there are multiple layers when it comes to evaluations on the job. Having a multifaceted evaluation score sheet that’s focusing on performance but also on social skills could be a great indicator for employee turnover. - Lastly responsibility and work ethics can be measured by
number_of_projects. It seems as if empowering people helps keep them on board.